Google Analytics provides a wealth of insights into website and app performance, helping you understand user behavior, traffic sources, and how well your marketing efforts are performing. Below are some key insights you can gain from Google Analytics:
1. Audience Insights
- Demographics: Understand the age, gender, and interests of your visitors.
- Geo-location: See where your visitors are located geographically.
- Devices: Find out what devices (desktop, mobile, tablet) and browsers your audience is using.
- User Behavior: Track how frequently and for how long users engage with your site, including new vs. returning visitors.
2. Acquisition Insights
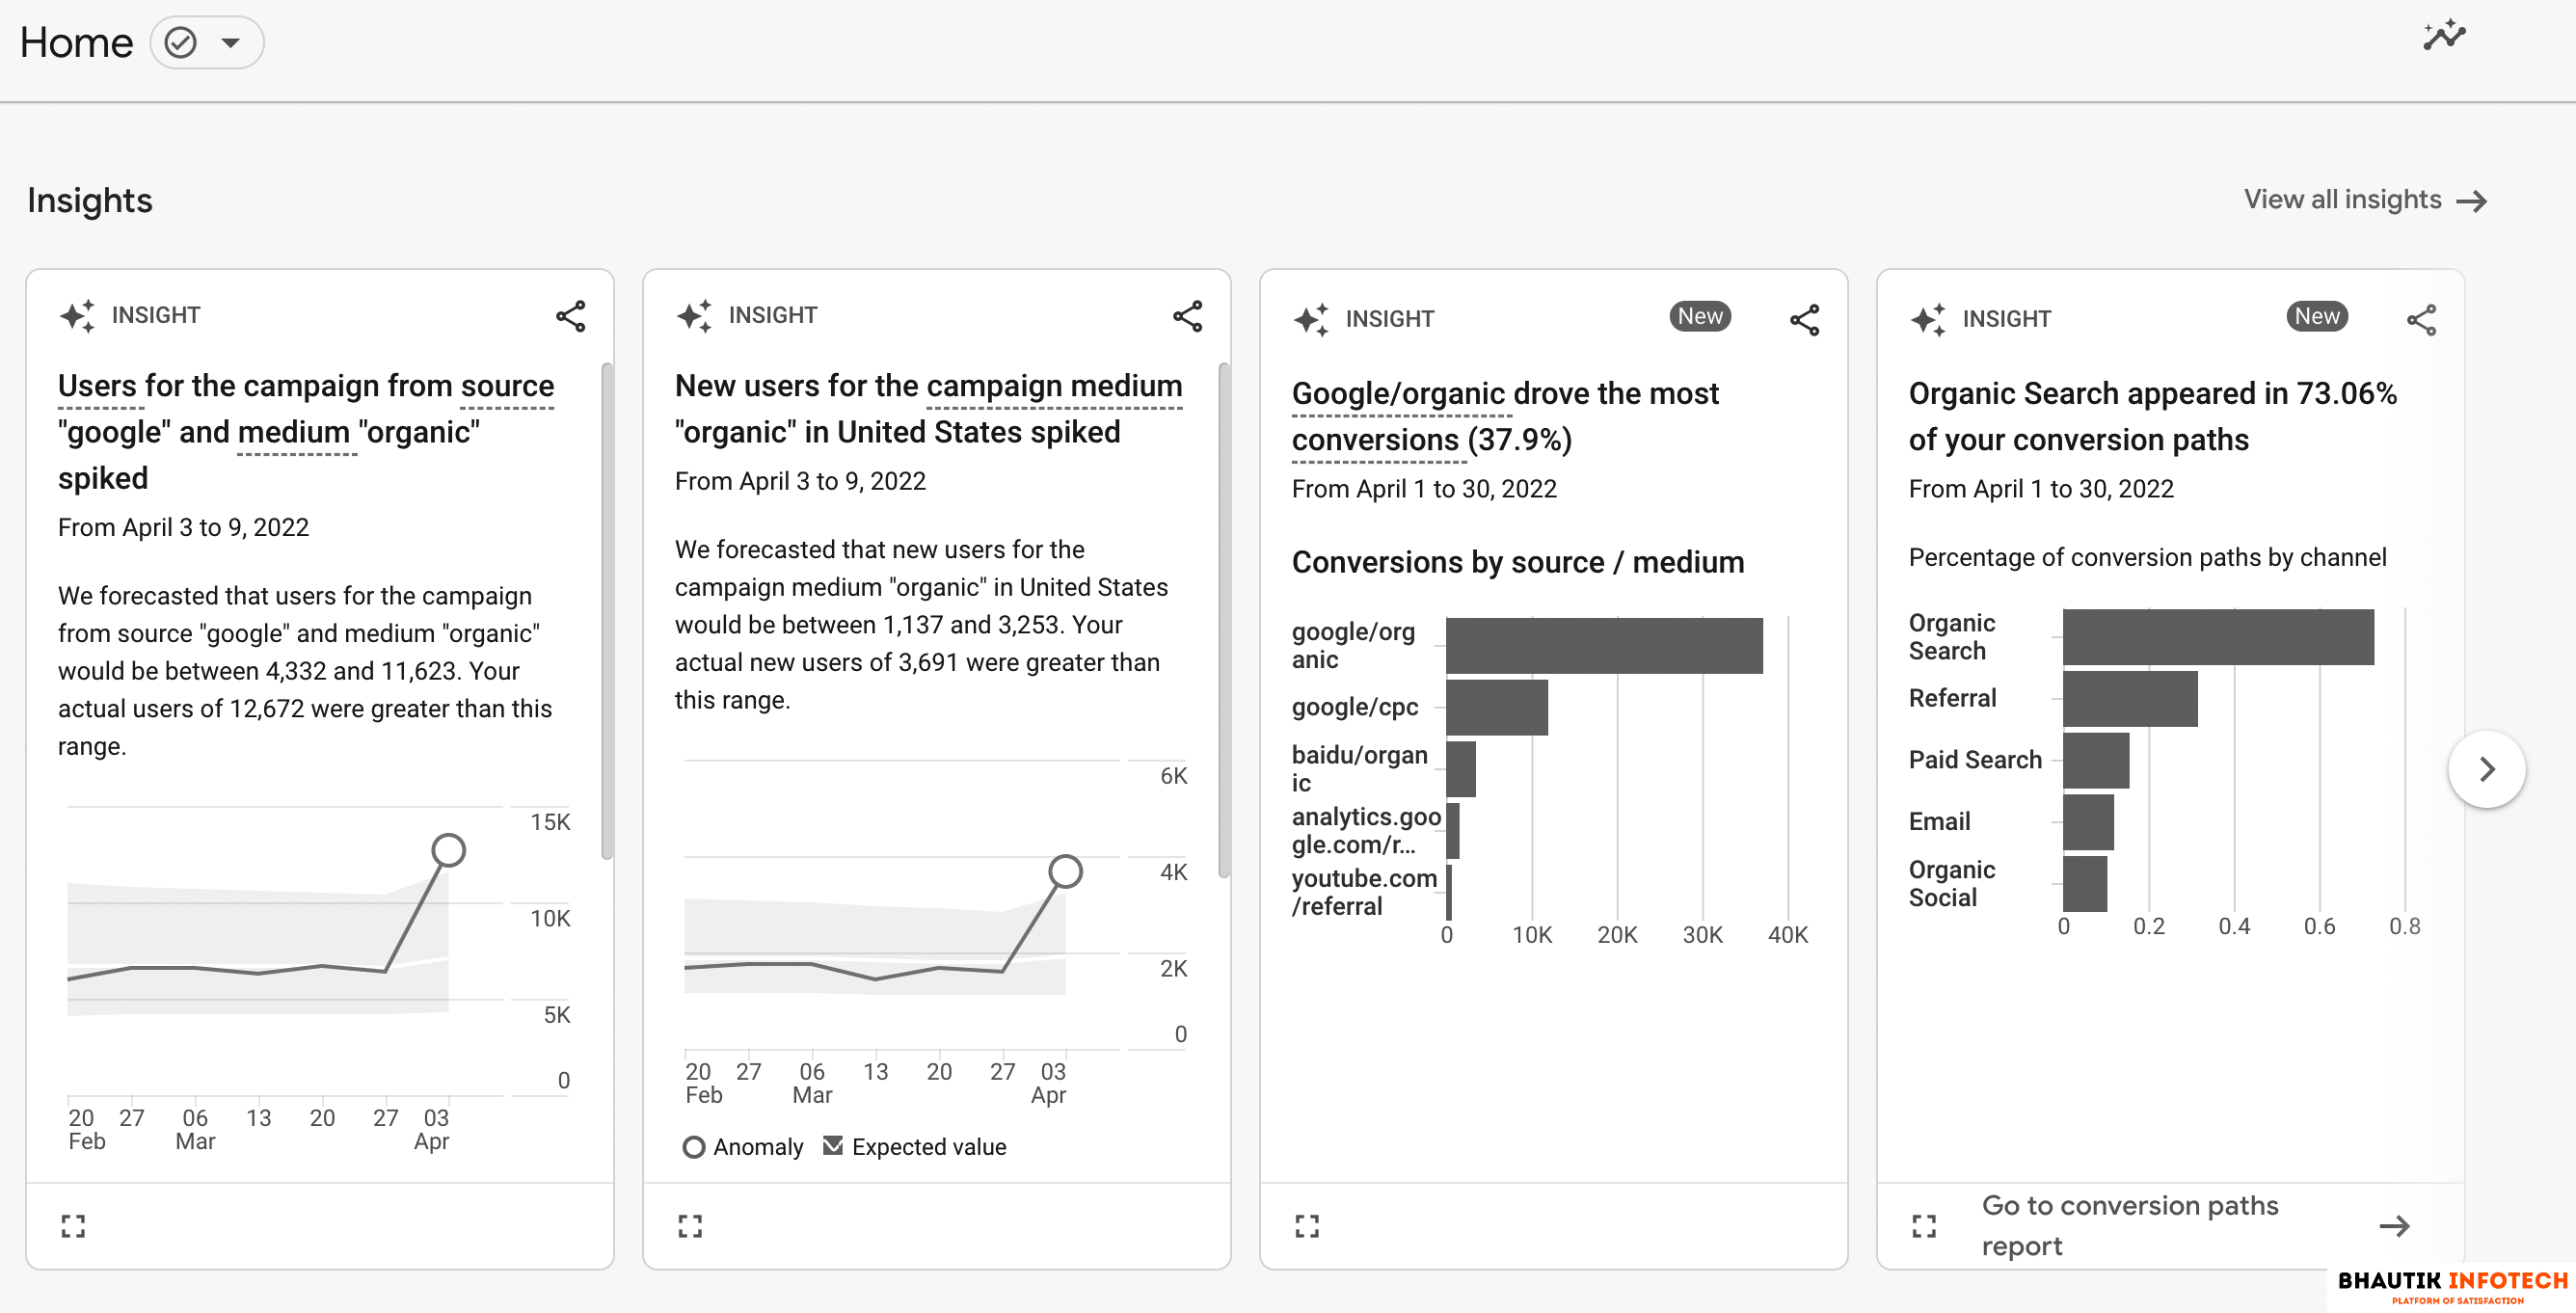
- Traffic Sources: Discover how users arrive at your site (e.g., organic search, social media, direct traffic, referrals, paid ads).
- Campaign Performance: Track the performance of specific marketing campaigns (Google Ads, email, social).
- Referral Traffic: Identify which external websites or platforms are sending traffic to your site.
3. Behavior Insights
- Pages & Content: See which pages on your site are the most popular and how users navigate between them.
- User Flow: Visualize the paths users take as they navigate through your site.
- Site Search: Track what users are searching for on your website’s internal search bar, helping identify content gaps.
- Engagement Metrics: Analyze metrics like bounce rate (percentage of users who leave after viewing one page), average session duration, and page views.
4. Conversion Insights
- Goals & Events: Track specific actions users take on your site (e.g., form submissions, downloads, purchases). You can set goals for these actions to measure conversion rates.
- E-commerce Tracking: For online stores, track transactions, product performance, average order value, and revenue.
- Multi-Channel Funnels: Understand how different marketing channels work together to lead users to conversion, showing the entire customer journey.
5. Real-Time Insights
- Live Data: Monitor live traffic to your site, including current visitors, their location, active pages, and traffic sources.
- Real-Time Events: Track immediate actions users are taking, which can be useful for monitoring campaign launches or content updates.
6. Custom Reporting
- Dashboards & Reports: Create customized dashboards and reports tailored to specific metrics or KPIs important to your business.
- Segmenting Data: Apply segments to isolate and analyze specific subsets of users (e.g., by device, location, or behavior).
- Cohort Analysis: Analyze user groups based on shared characteristics or timeframes, to understand retention and long-term engagement.
7. Advanced Insights
- Attribution Modeling: Analyze how different channels contribute to conversions and customer journeys, using different attribution models (first-click, last-click, linear, etc.).
- Audience Retargeting: Identify audiences for retargeting based on specific behaviors, and export these segments to Google Ads for focused campaigns.
- Custom Dimensions & Metrics: Track data points unique to your business that aren’t covered by default dimensions and metrics.
Key Metrics to Track
- Sessions: Total number of visits.
- Users: Unique visitors to your site.
- Pageviews: Total views of your pages.
- Average Session Duration: Average time users spend on your site.
- Bounce Rate: Percentage of users who leave after viewing only one page.
- Conversion Rate: Percentage of users who complete a goal (purchase, form submission, etc.).
Google Analytics offers a deep dive into data and user activity, helping businesses optimize their strategies, content, and campaigns based on actionable insights.
Google Analytics अंतर्दृष्टि को समझना
Google Analytics insights आपको वेबसाइट और ऐप के प्रदर्शन को समझने में मदद करते हैं। यह उपयोगकर्ता व्यवहार, ट्रैफ़िक स्रोतों और आपकी मार्केटिंग प्रयासों की प्रभावशीलता के बारे में जानकारी प्रदान करता है। यहाँ Google Analytics से प्राप्त किए जा सकने वाले प्रमुख insights का विवरण दिया गया है:
1. ऑडियंस insights
- डेमोग्राफिक्स (जनसांख्यिकी): जानें कि आपकी साइट पर आने वाले उपयोगकर्ता किस आयु वर्ग और लिंग के हैं और उनकी रुचियाँ क्या हैं।
- भू-स्थान: यह देखें कि आपके विज़िटर भौगोलिक रूप से कहाँ से आ रहे हैं।
- डिवाइस: पता करें कि आपके उपयोगकर्ता कौन से उपकरण (डेस्कटॉप, मोबाइल, टैबलेट) और ब्राउज़र का उपयोग कर रहे हैं।
- उपयोगकर्ता व्यवहार: देखें कि कितनी बार और कितनी देर तक उपयोगकर्ता आपकी साइट पर सक्रिय रहते हैं, और नए और पुराने उपयोगकर्ताओं के बीच अंतर को समझें।
2. अधिग्रहण (Acquisition) insights
- ट्रैफ़िक स्रोत: जानें कि उपयोगकर्ता आपकी साइट पर कैसे आ रहे हैं (जैसे, ऑर्गेनिक सर्च, सोशल मीडिया, डायरेक्ट ट्रैफ़िक, रेफ़रल्स, पेड विज्ञापन)।
- अभियान प्रदर्शन: जानें कि आपके मार्केटिंग अभियानों (जैसे Google Ads, ईमेल, सोशल) का प्रदर्शन कैसा है।
- रेफ़रल ट्रैफ़िक: पता करें कि कौन सी बाहरी वेबसाइटें या प्लेटफ़ॉर्म आपकी साइट पर ट्रैफ़िक भेज रहे हैं।
3. व्यवहार (Behavior) insights
- पृष्ठ और सामग्री: यह देखें कि आपकी साइट पर कौन से पृष्ठ सबसे लोकप्रिय हैं और उपयोगकर्ता किस तरह से नेविगेट कर रहे हैं।
- उपयोगकर्ता प्रवाह (User Flow): यह दर्शाता है कि उपयोगकर्ता आपकी साइट पर कैसे नेविगेट कर रहे हैं।
- साइट सर्च: पता करें कि उपयोगकर्ता आपकी वेबसाइट के सर्च बार में क्या खोज रहे हैं, ताकि आप कंटेंट गैप्स को पहचान सकें।
- इंगेजमेंट मैट्रिक्स: बाउंस रेट (वेबसाइट पर सिर्फ एक पेज देखने के बाद बाहर जाने वाले उपयोगकर्ताओं का प्रतिशत), औसत सत्र अवधि, और पेज व्यूज़ जैसी मेट्रिक्स को ट्रैक करें।
4. कन्वर्ज़न (Conversion) insights
- लक्ष्य और इवेंट्स: उपयोगकर्ताओं द्वारा की गई विशिष्ट क्रियाओं को ट्रैक करें, जैसे फॉर्म भरना, डाउनलोड करना, या खरीदारी करना।
- ई-कॉमर्स ट्रैकिंग: ऑनलाइन स्टोर्स के लिए, लेन-देन, उत्पाद प्रदर्शन, औसत ऑर्डर वैल्यू और राजस्व को ट्रैक करें।
- मल्टी-चैनल फ़नल्स: यह समझें कि विभिन्न मार्केटिंग चैनल उपयोगकर्ताओं को कन्वर्ज़न तक पहुंचाने में कैसे एक साथ काम करते हैं।
5. रियल-टाइम insights
- लाइव डेटा: अपनी साइट पर वर्तमान में कितने विज़िटर हैं, वे कहाँ से आ रहे हैं, कौन से पृष्ठ देख रहे हैं और वे किस स्रोत से आए हैं, इसे रियल-टाइम में देखें।
- रियल-टाइम इवेंट्स: तुरंत उपयोगकर्ताओं द्वारा की जा रही क्रियाओं को ट्रैक करें, विशेष रूप से नए अभियानों या सामग्री अपडेट के समय।
6. कस्टम रिपोर्टिंग
- डैशबोर्ड और रिपोर्ट्स: आप अपनी आवश्यकताओं के अनुसार कस्टम डैशबोर्ड और रिपोर्ट्स बना सकते हैं।
- सेगमेंटिंग डेटा: डेटा के विशिष्ट हिस्सों (जैसे डिवाइस, स्थान, या व्यवहार) को अलग करके उनका विश्लेषण करें।
- कोहोर्ट एनालिसिस: समय-समय पर विशिष्ट उपयोगकर्ता समूहों का विश्लेषण करें ताकि रिटेंशन और दीर्घकालिक इंगेजमेंट को समझा जा सके।
7. उन्नत (Advanced) insights
- एट्रिब्यूशन मॉडलिंग: विभिन्न चैनल किस तरह से कन्वर्ज़न में योगदान करते हैं, इसे जानने के लिए एट्रिब्यूशन मॉडल्स (फर्स्ट-क्लिक, लास्ट-क्लिक, लाइनियर, आदि) का उपयोग करें।
- ऑडियंस रीटार्गेटिंग: विशिष्ट व्यवहारों के आधार पर ऑडियंस की पहचान करें और इन्हें Google Ads में एक्सपोर्ट कर रीटार्गेटिंग के लिए उपयोग करें।
- कस्टम डायमेंशन्स और मेट्रिक्स: आपके बिज़नेस से जुड़े अनोखे डेटा पॉइंट्स को ट्रैक करें, जो डिफ़ॉल्ट मेट्रिक्स में नहीं आते।
महत्वपूर्ण मैट्रिक्स जिन्हें ट्रैक करना चाहिए
- सेशंस: कुल विज़िट की संख्या।
- यूजर्स: आपकी साइट पर आने वाले अद्वितीय विज़िटर्स।
- पेजव्यूज: कुल पृष्ठों के दृश्य।
- औसत सत्र अवधि: उपयोगकर्ता आपकी साइट पर औसतन कितनी देर तक रहते हैं।
- बाउंस रेट: एक पेज देखने के बाद बाहर निकलने वाले उपयोगकर्ताओं का प्रतिशत।
- कन्वर्ज़न रेट: उन उपयोगकर्ताओं का प्रतिशत जो किसी लक्ष्य (जैसे खरीदारी, फॉर्म सबमिशन) को पूरा करते हैं।
Google Analytics आपको आपके व्यापार को बेहतर बनाने, वेबसाइट पर उपयोगकर्ताओं के अनुभव को सुधारने और मार्केटिंग अभियानों को अधिक प्रभावी बनाने में मदद कर सकता है।